
Introduction
In the realm of collaborative software development, pull requests play a pivotal role in code integration and review. However, understanding the key factors that determine the success of pull requests can be complex.
In this blog post, we utilize machine learning to uncover insights into the crucial factors impacting pull request outcomes. By analyzing a diverse dataset collected from various repositories using the GitHub API, we reveal the factors that significantly influence the decision to merge or reject pull requests.
Through data cleaning, feature engineering, and model training, we identify the most impactful characteristics. Our analysis highlights factors like the number of commits, review comment count, and time difference between creation and last update as key contributors to pull request success.
By leveraging the power of machine learning, we provide valuable insights to development teams, enabling them to optimize their workflow and improve the chances of successful code integration.
Join us as we explore the fascinating dynamics of pull requests and unlock the potential of machine learning to gain deeper understanding in this essential aspect of software development.
Note: You can download the code and Goolge Collab from github here
What is a Pull Request?
For those who may be less familiar with the concept, a pull request is a fundamental component of the development process. It represents a formalized request to merge changes made in a branch or fork of our code repository into the main branch, typically referred to as the “master” or “main” branch. Pull requests allow team members to propose modifications, additions, or fixes, providing an opportunity for thorough review and discussion before merging the changes into the main codebase.
Collecting data
GitHub is the optimal resource for gathering pull requests, and I utilized the GitHub API to accomplish this task. The API offers a user-friendly and efficient approach; however, it does have a limitation of 5000 requests per hour. To ensure a diverse dataset, I selected multiple repositories to collect pull requests from. Below is a description of the collected data
- Ansible :: 2200 PR
- Aiida :: 700 PR
- Pandas :: 2000 PR
- Matplotlib :: 1900 PR
- NNI :: 1600 PR
- Jinja :: 700 PR
- Gym :: 1000 PR
- Django :: 6800 PR
Total: 16900 Pull Requests!
I collected the following information from each pull request:
- merged_at: Indicates the date and time of the merge.
- author_followers: Represents the number of followers the author has.
- updated_at: Specifies the most recent update timestamp.
- created_at: Indicates the pull request’s creation date.
- requested_reviewers: Shows the count of requested reviewers.
- repo_size: Represents the size of the entire repository.
- repo_open_issues_count: Indicates the current number of open issues in the repository.
- repo_watchers: Represents the current count of users watching the repository.
- author_association: Indicates the role or association of the author.
- merged: A boolean value indicating whether the pull request was merged (true) or not (false).
- commits: Specifies the number of commits associated with the pull request.
- additions: Represents the number of lines added in the pull request.
- deletions: Indicates the number of lines removed in the pull request.
- changed_files: Specifies the number of files changed in the pull request.
- body_length: Represents the length of the pull request description.
- mergable_status: Give information if the pull request can be merged or not.
- comments_count: The number of comments in this pull request.
- review_comments_count: The number of review comments in this pull request.
Once I have collected the pull requests from each repository, I save the data in a file format known as JSON. This allows for efficient storage and retrieval of the gathered information.
Note: It is important to mention that all the pull requests that have been collected are in a closed state, indicating that they have either been merged or rejected.
Data cleaning and Features Engineering
After collecting the data and saving it in a JSON file, I will load it into my Google Colab project and convert it into a Pandas object. Utilizing the functionality provided by Pandas, I will use the following command to obtain a descriptive summary of the data:
df.info()
I got this result:
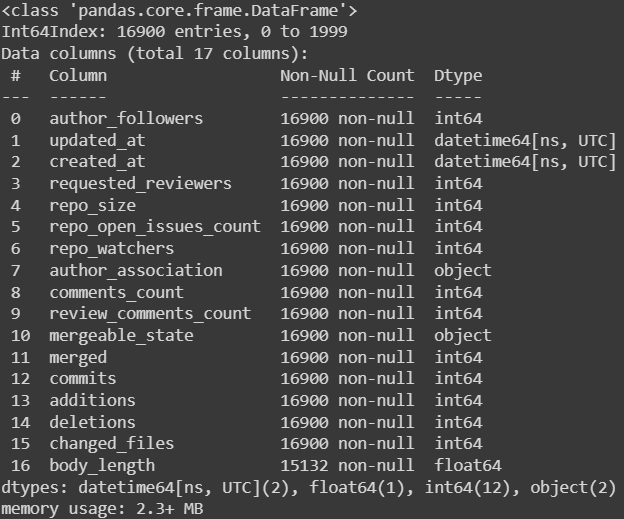
As we can observe, the collected data consists of multiple data types, which need to be converted to a unified type (int64). To accomplish this, I employed the "astype(int)" function.
Additionally, upon examining the provided photo, we noticed the presence of null values in the “body_length” column. To address this issue, we opted to remove the rows containing null values, utilizing the “dropna” function.
Furthermore, it came to our attention that there are two datetime objects, namely “created_at” and “updated_at,” which cannot be directly utilized in the model. To overcome this challenge, we created a new variable that captures the time duration between the creation of the pull request and its last update. This newly created feature proves to be more meaningful and suitable for incorporation into our model.
Here is the code encompassing all the aforementioned operations:
df = df.dropna()
df['time_diffrence'] = (df['updated_at'] - df['created_at']).dt.total_seconds()/60/60
df.drop('updated_at', axis=1, inplace=True)
df.drop('created_at', axis=1, inplace=True)
df['time_diffrence'] = df['time_diffrence'].astype(int)
df['body_length'] = df['body_length'].astype(int)
df['merged'] = df['merged'].astype(int)
One hot Encoding
Upon revisiting our data, we observe the presence of a feature called “author_association.” This feature is an object that represents one of the following variables: [COLLABORATOR, CONTRIBUTOR, MEMBER, NONE]. However, we cannot directly use this object in our model. To address this, we need to perform a preprocessing step known as one-hot encoding. This process will generate a separate feature for each possible value within the object.
To accomplish this, I implemented the following code, which performed the one-hot encoding:
one_hot = pd.get_dummies(df['author_association'], prefix='author_association')
df = pd.concat([df, one_hot], axis=1)
By executing this code, we successfully transformed the ‘author_association’ feature into individual binary features, allowing us to utilize them effectively in our model.
Data Leakage
Finally, we encounter one remaining issue with our data. Since our goal is to build a model that predicts whether a pull request will be merged or not, we must address the inclusion of the “mergable_status” feature. Utilizing this particular feature in our model would introduce data leakage, as it would provide direct insight into the prediction label. Consequently, to ensure the integrity and accuracy of our model, I have decided to remove this feature from the dataset.
Data insights
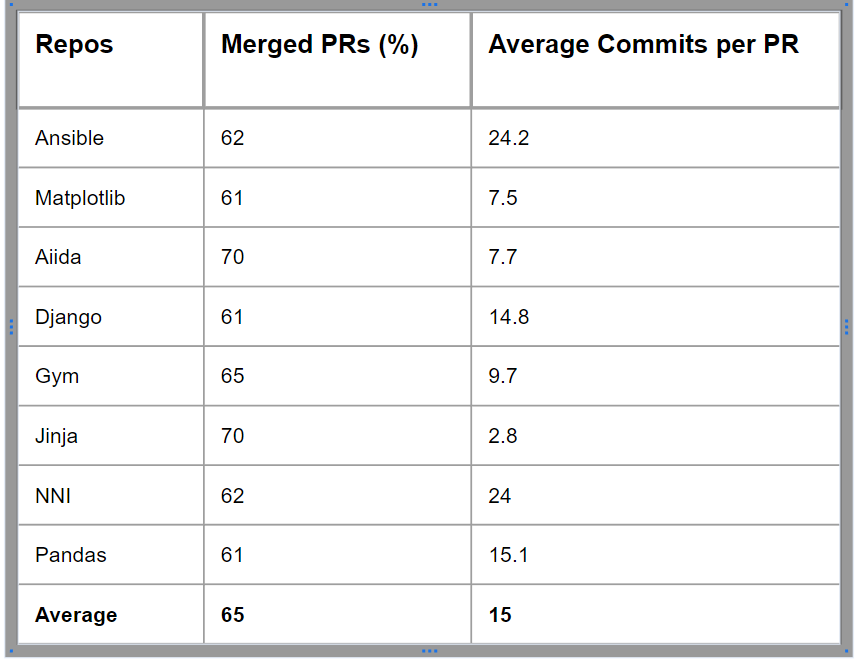
To ensure diversity within our dataset, I calculated the percentage of merged pull requests for each repository and also determined the average number of commits. These metrics provide valuable insights into the distribution and characteristics of the data, contributing to a more comprehensive and representative dataset.
Now, let’s proceed with splitting our data into training, validation, and testing sets. This can be achieved using the following simple code:
from fast_ml.model_development import train_valid_test_split
X_train, y_train, X_valid, y_valid, X_test, y_test = train_valid_test_split(df, target = 'merged',
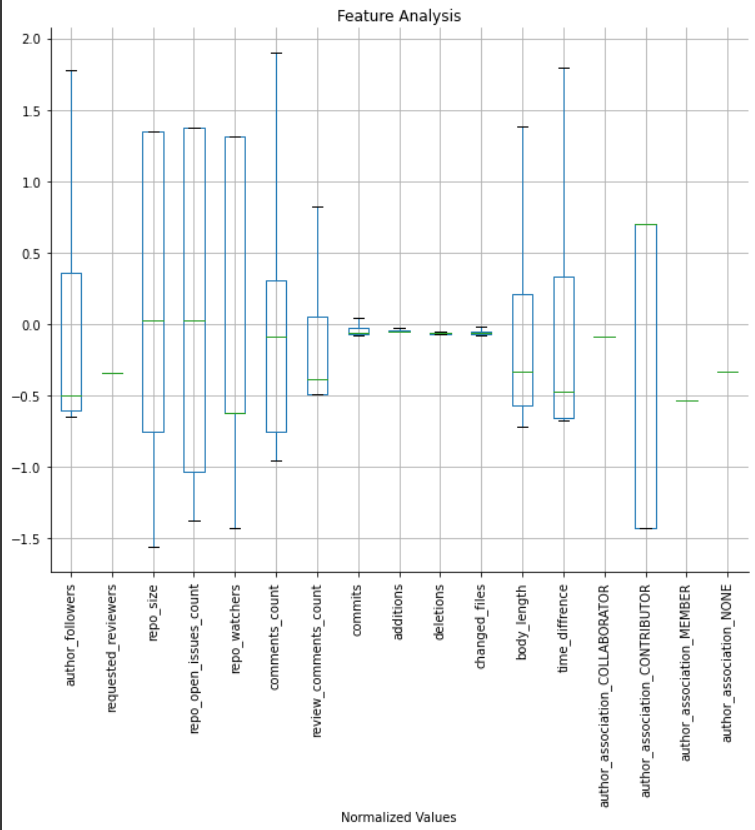
train_size=0.8, valid_size=0.1, test_size=0.1)Following the data splitting process, let’s proceed by visualizing the distribution of our standardized training data using a box plot. This plot will provide us with valuable insights into the distribution of our data. Below is the code I used to generate the box plot:
fig, axs = plt.subplots(1,1,figsize=(10,8))
axs.set_title('Feature Analysis')
axs.set_xlabel('Normalized Values')
pd.DataFrame(data=X_train_s, columns=df.columns).boxplot(figsize=(10,8), rot=90, ax = axs, showfliers=False)
And here is the result:
Train and Evaluate
Now, it’s time to train our data. Since our objective is classification, we will employ a simple Logistic Regression model from the sklearn library. Subsequently, we will generate a confusion matrix and calculate the accuracy, recall, and precision scores. Here is the code:
from sklearn.linear_model import LogisticRegression
import matplotlib.pyplot as plt

lin_reg = LogisticRegression()
lin_reg.fit(X_train_s, y_train)

y_train_pred = lin_reg.predict(X_train_s)
y_test_pred = lin_reg.predict(x_test_s)

from sklearn import metrics

confusion_matrix = metrics.confusion_matrix(y_train, y_train_pred)
cm_display = metrics.ConfusionMatrixDisplay(confusion_matrix = confusion_matrix, display_labels = [False, True])

cm_display.plot()
plt.show()

Accuracy = metrics.accuracy_score(y_train, y_train_pred)

print(Accuracy)
print(metrics.recall_score(y_train, y_train_pred))
print(metrics.precision_score(y_train, y_train_pred))
print(metrics.f1_score(y_train, y_train_pred))
Here is the result of evaluating the model using the test data:
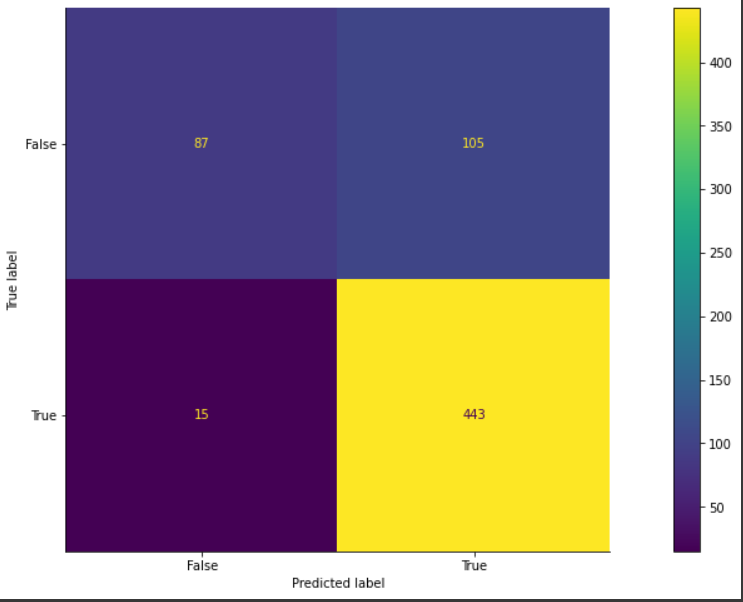
Accuracy = 0.8153846153846154
Recall = 0.9672489082969432
Precision = 0.8083941605839416
F1 score = 0.8807157057654076
Deep Learning
After utilizing the logistic regression model, I proceeded to explore the effectiveness of a neural network model in capturing non-linear relationships between features. Although the neural network model produced slightly improved results, in my opinion, the marginal gain does not justify its usage in our specific application.
Below is the code to build and train the neural network:
import tensorflow as tf
tf.random.set_seed(42)


model = tf.keras.Sequential([
    tf.keras.layers.Dense(128, activation='relu'),
    tf.keras.layers.Dense(256, activation='relu'),
    tf.keras.layers.Dense(1, activation='sigmoid')
])

model.compile(
    loss=tf.keras.losses.binary_crossentropy,
    optimizer=tf.keras.optimizers.Adam(lr=0.03),
    metrics=[
        tf.keras.metrics.BinaryAccuracy(name='accuracy'),
        tf.keras.metrics.Precision(name='precision'),
        tf.keras.metrics.Recall(name='recall')
    ]
)
my_callback = tf.keras.callbacks.EarlyStopping(monitor="val_loss", patience=10)

history = model.fit(X_train_s, y_train, epochs=50, validation_data = (x_validate_s, y_valid), callbacks=[my_callback])
Features Importance
This is the most critical aspect of the project, as it reveals which features of the pull request have the greatest impact on the model’s decision-making process. By analyzing these findings, we can determine the most significant characteristics of a pull request.
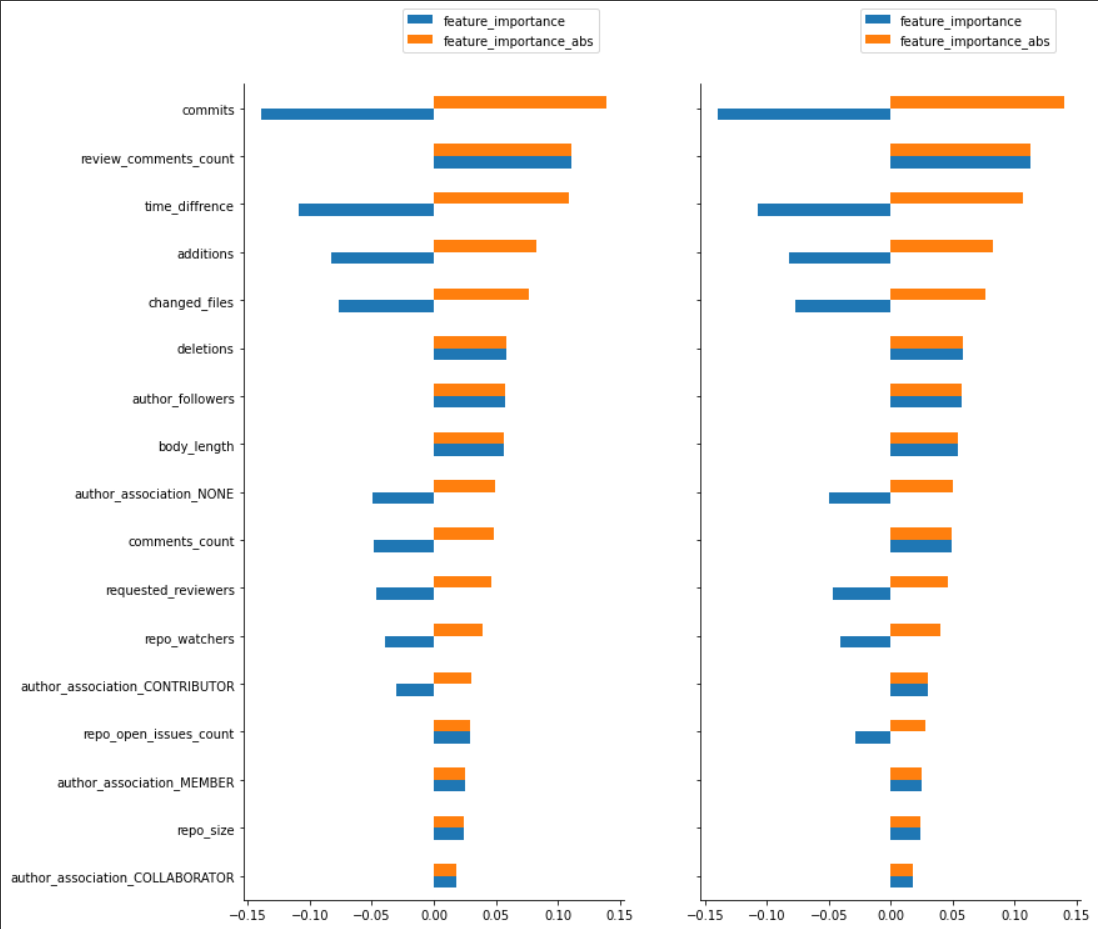
As depicted in the image above, we observe that the most influential feature on the model’s decision-making process is the number of commits in the pull request. Interestingly, this feature has a negative impact, indicating that a higher number of commits may make it more challenging to have the pull request merged. Conversely, the “review_comments_count” feature exhibits a positive impact, suggesting that an increased count of review comments positively influences the model’s decision.
Furthermore, it is worth noting the presence of the “time_difference” feature, which represents the duration between the creation of the pull request and its last update. This feature has a negative impact, indicating that a longer duration without updates from the author may make it more difficult to merge the pull request successfully.
By analyzing these findings, we can gain insights into the most critical characteristics of a pull request and their influence on the model’s decision.
conclusion
In conclusion, our analysis of pull request data using machine learning provided valuable insights into the factors that impact the success of code integration. By examining a diverse dataset from multiple repositories, we identified crucial contributors such as the number of commits, review comment count, and time difference between creation and last update.
These findings offer development teams actionable information to optimize their workflow and enhance the likelihood of successful pull request merging. Leveraging machine learning empowers teams to make data-driven decisions, improving collaboration and code integration within their projects.
By understanding the significant characteristics of pull requests and their influence on the model’s decision-making process, teams can prioritize their efforts and create a more efficient and collaborative coding environment.